


DUTCH hormone testing : a full map of your hormones, not just a snapshot
Who can hormonal testing help support ?

If digestive symptoms are also part of the picture, the gut dysbiosis marker on this sample report is a good example of why gut and hormone health are often connected. In some cases the GI Effects and DUTCH together give a more complete picture than either alone.
Perimenopause: mood, sleep, hot flushes, weight changes
Irregular or heavy periods
Burnout or prolonged high-stress periods
Hair thinning or acne with "normal" testosterone
Mood changes without a clear cause
PMS or second-half-of-cycle symptoms
Persistent fatigue, especially with poor stress resilience
Sleep that doesn't feel restorative
Low libido
A standard hormone blood test gives you one number at one moment in time.
The DUTCH Complete (Dried Urine Test for Comprehensive Hormones) collects 4 urine samples across a single day.
Where relevant the test can be timed to your cycle, giving a picture of
how your hormones are behaving across time,
how they're being metabolised, and
what your stress hormone pattern looks like from waking to bedtime.
It's the difference between a photograph and a film.

Sample DUTCH Hormone Testing Summary page
Why the DUTCH shows things a standard blood test often can't
Standard blood test
A single oestrogen or progesterone value. Tells you a hormone is present, not whether its daily pattern, metabolic pathway or relationship to other hormones is healthy.
Compared to
DUTCH Complete
Four timed samples. Shows cortisol rhythm, how oestrogen is being cleared, the ratio between hormones, and markers of B-vitamin status, gut health and neuroinflammation.
What the DUTCH measures
Oestrogen & progesterone
Levels and their downstream metabolites — showing how your body is producing and clearing them, not just whether they're present
Androgens (DHEA, testosterone)
Total androgen production and how they're being metabolised — relevant to energy, libido, hair and skin symptoms
Cortisol rhythm
Four readings from waking to bedtime, mapping your actual stress-hormone curve — something a blood test at a single point cannot capture
Organic acid markers (OATs)
B12, B6, gut dysbiosis, neuroinflammation and melatonin — nutrients that directly influence how hormones behave
What results look like - and what they suggest
Below is a walkthrough of a real sample DUTCH Complete report, showing what each section reveals and the direction it points.
Every person's picture is different; this illustrates the kind of layered information the test provides.
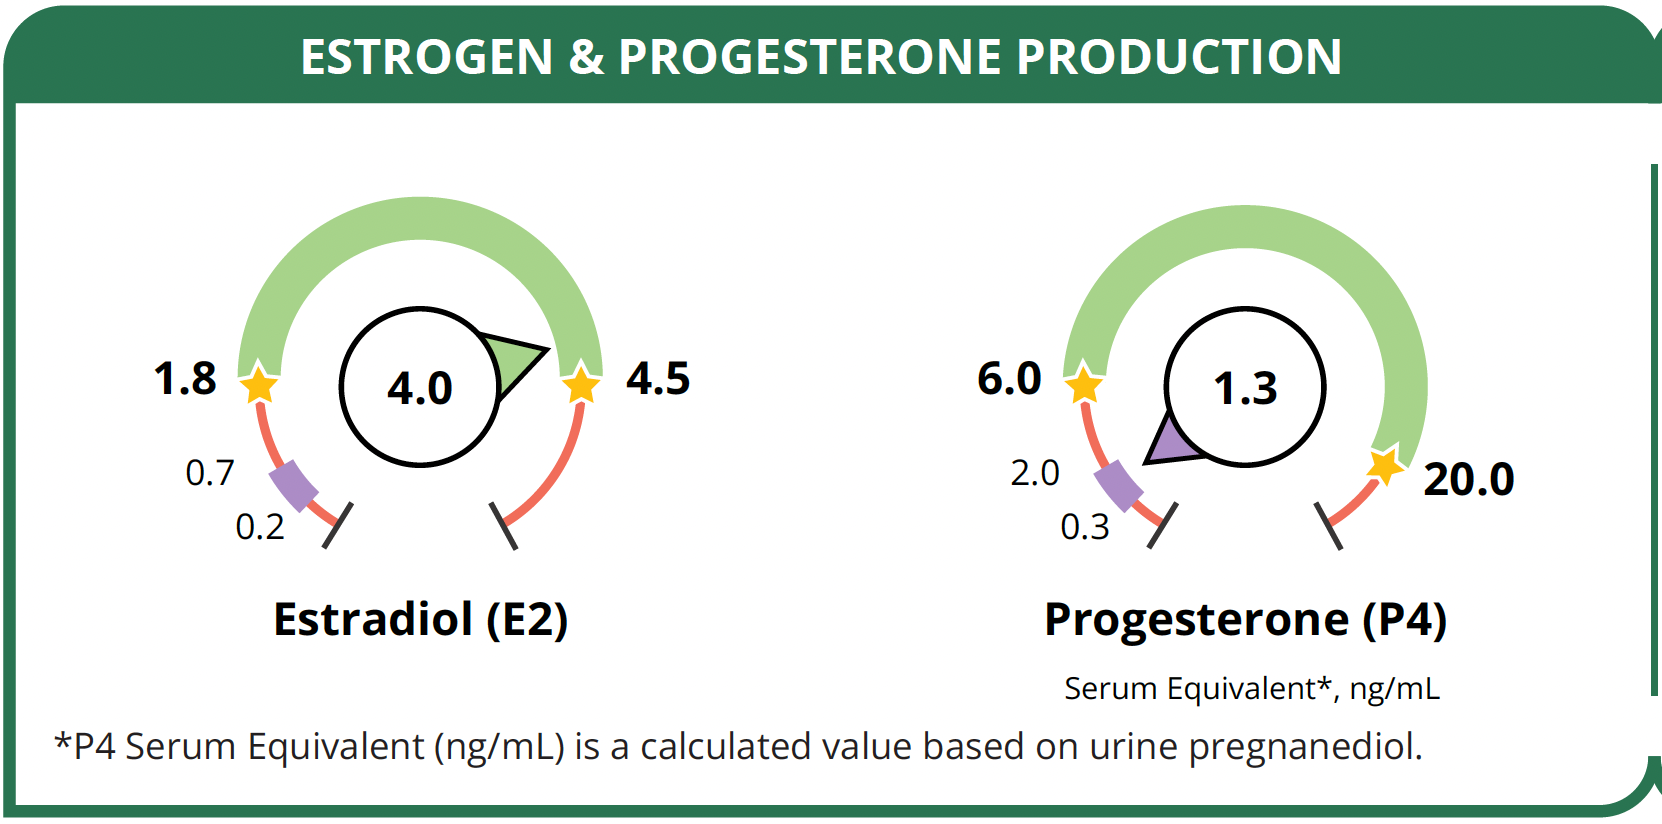
Oestrogen & Progesterone
Oestradiol is at the higher end of the optimal luteal range
This is not alarming in isolation, but meaningful when read alongside progesterone, which is well below where it should be at this point in the cycle. This oestrogen-dominant picture is one of the most common patterns in perimenopause, where progesterone tends to decline first, leaving oestrogen relatively unchecked.
It's associated with symptoms including breast tenderness, mood shifts in the second half of the cycle, heavy or irregular periods, and poor sleep around menstruation.
A blood test showing "oestrogen within range" would completely miss this pattern - because the issue isn't oestrogen alone, it's the ratio.
This suggests: support directed at the progesterone side of this balance, understanding what might be suppressing production, alongside looking closely at how oestrogen is being processed and cleared.
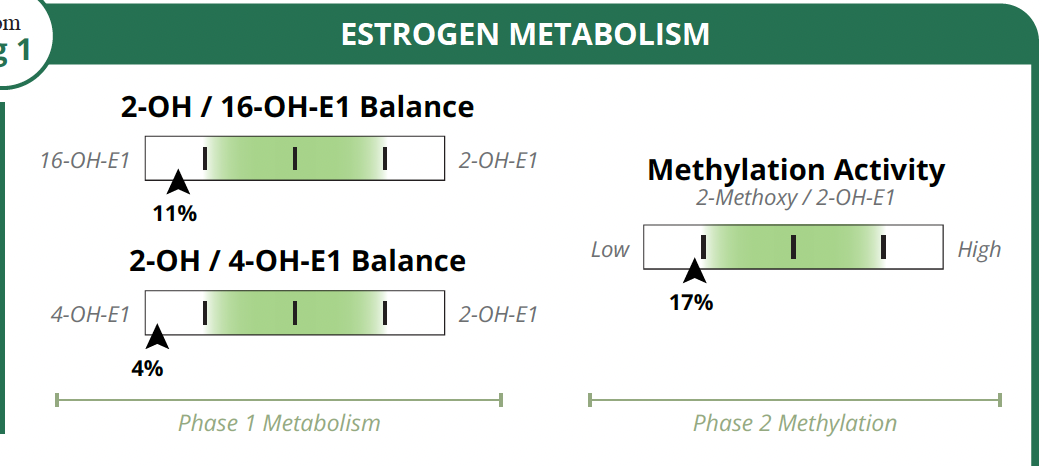
Oestrogen Metabolism (Phase 1 & 2)
This is one of the most clinically valuable sections of the DUTCH — and one that simply cannot be assessed with a blood test. Oestrogen is broken down via several pathways. The "2-OH" pathway is the most protective; the "16-OH" and "4-OH" pathways are less desirable. In this report, the balance is skewed toward both 16-OH and 4-OH metabolites — a pattern associated with stronger oestrogenic activity and, in the case of 4-OH, a marker linked to oxidative stress.
Methylation: the process that neutralises the reactive 4-OH metabolite before it can cause harm, is also running at the low end of range, suggesting the pathway responsible for safe oestrogen clearance isn't working at full capacity.
This suggests: support for specific oestrogen clearance pathways, not generic "hormone balancing," but targeted work on the precise steps that are lagging. The OAT markers on this report (B12 and B6 both flagged) connect directly here, as both are essential for methylation.
Cortisol: Daily Pattern & Metabolism
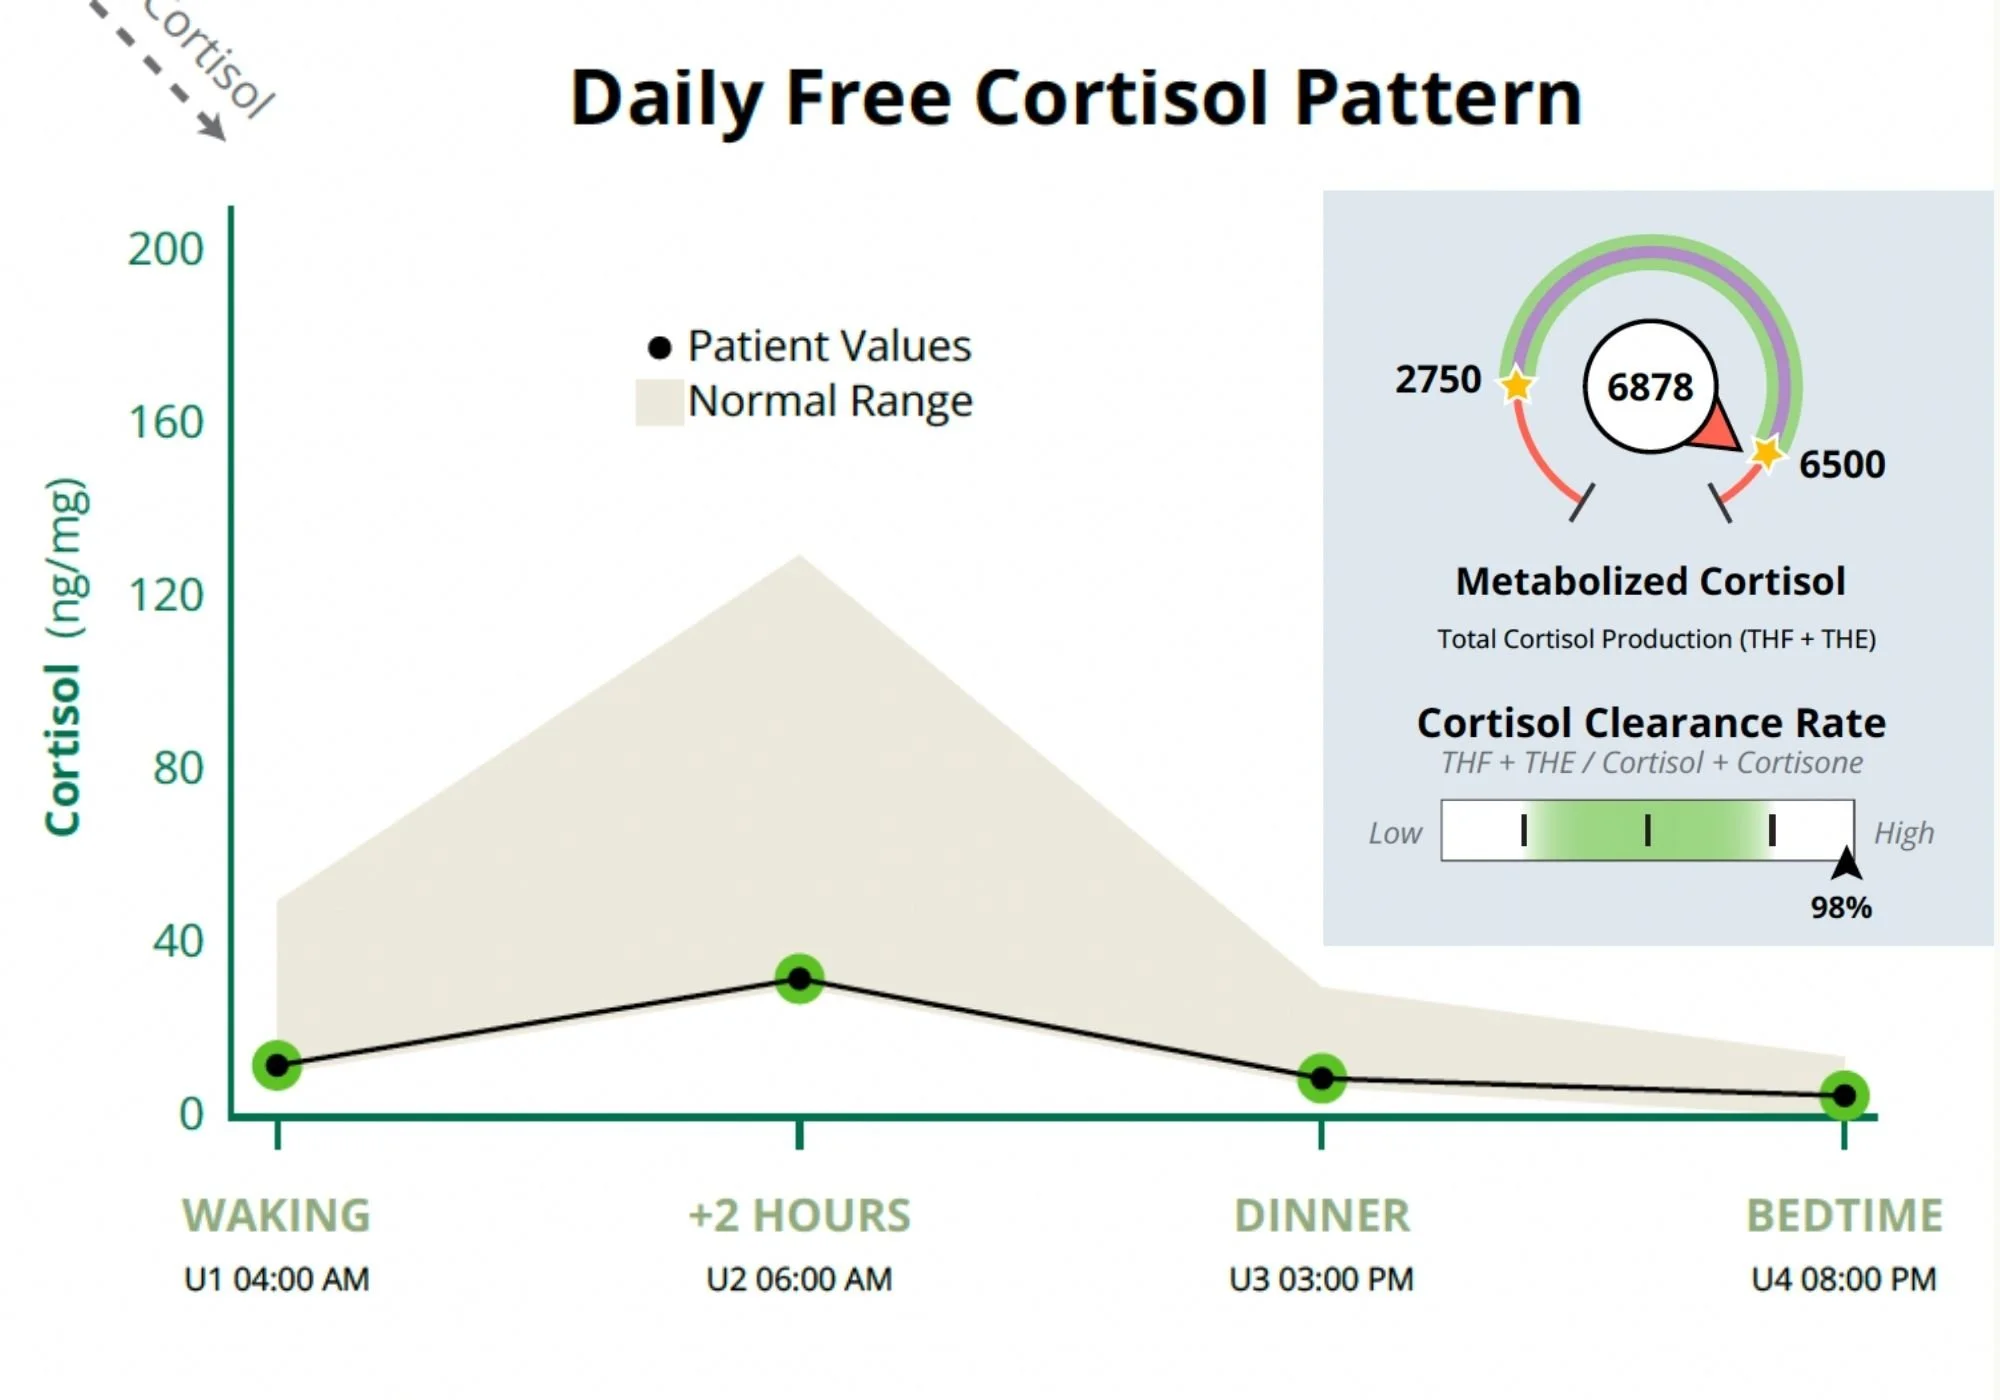
The cortisol picture here illustrates exactly why the DUTCH is more informative than a single cortisol blood test.
Free cortisol (the amount circulating at any given point) is low across all four time points.
Taken alone, this might suggest low cortisol output. But the metabolised cortisol (reflecting total daily cortisol production by the adrenal glands) is actually above range.
The explanation is in the clearance rate: at 98%, this person's body is clearing cortisol almost twice as fast as expected, meaning -
production is adequate but the hormone isn't staying in circulation long enough to do its job.
This is a pattern that explains persistent fatigue, poor stress resilience, and difficulty with energy regulation — but points in a different direction to someone whose cortisol is low because of adrenal insufficiency. Without the clearance data, these two very different pictures look identical on a standard test.
This suggests: the focus is on what's driving the fast clearance rate — rather than simply trying to raise cortisol. The full picture, including lifestyle, metabolic and inflammatory factors, shapes how this is approached.
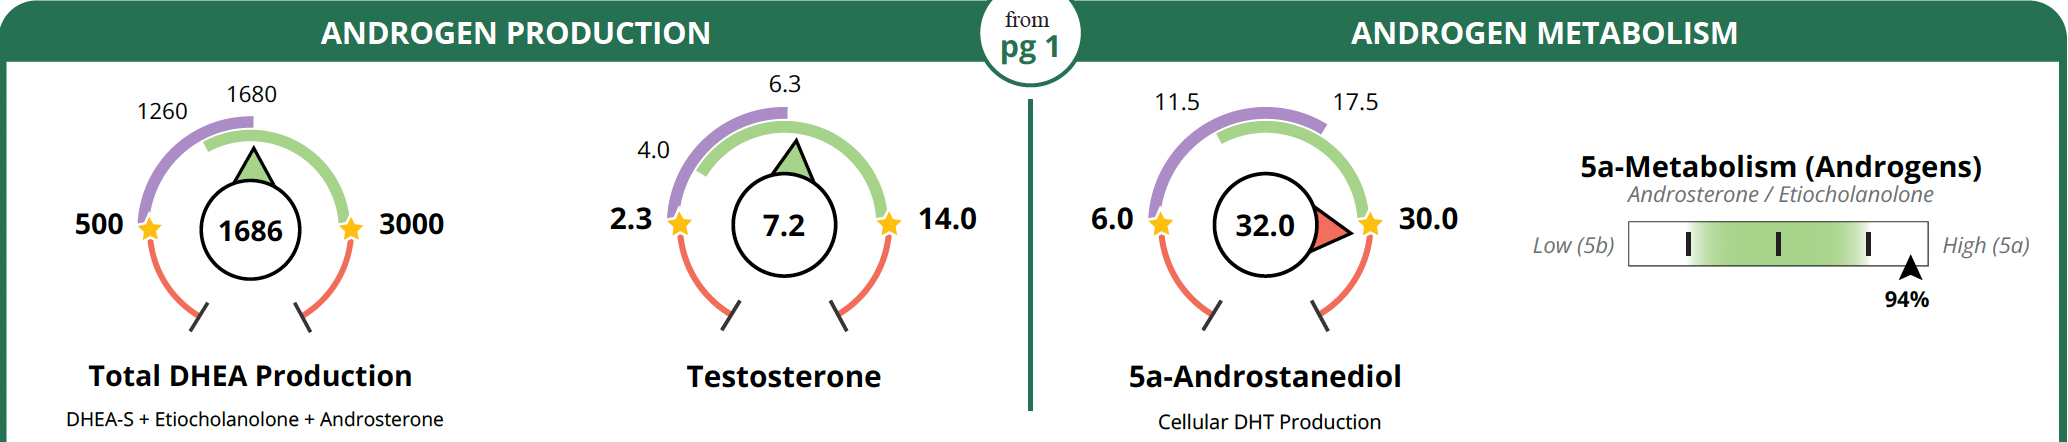
Androgens: DHEA, Testosterone & DHT
Total DHEA production and testosterone are both within range — but the picture changes when you look downstream. DHEA-S is low (which can occur when inflammation diverts DHEA away from its usual pathway), and 5a-androstanediol — a marker that reflects how much DHT activity is happening at a cellular level — is above range. At 94%, this person's androgen metabolism is strongly biased toward the more potent androgenic pathway.
This pattern — normal testosterone but elevated tissue DHT activity — is one that a standard blood test would miss entirely. It can be relevant to symptoms including hair thinning, acne, or androgenic symptoms that don't match a "normal" testosterone result.
This suggests: understanding what's driving the shift toward the more androgenic pathway — inflammation is one common driver, which also connects to the low DHEA-S and the OAT findings below.
“Normal testosterone levels
BUT - your hair’s thinning, got acne, or androgenic symptoms”
Organic Acid Markers (OATs)
One of the features that makes the DUTCH Complete particularly useful is the inclusion of organic acid markers. These aren't hormone values, but they illuminate why the hormone picture looks the way it does. In this report:
B12 Deficiency marker
B6 Deficiency marker
GI Dysbiosis marker
Neuroinflammation marker
Melatonin Low
These findings connect directly to the hormone results.
B12 and B6 are both essential for methylation (the process that neutralises reactive oestrogen metabolites). Both are flagged here, which goes a long way toward explaining why the oestrogen methylation step is running low.
The gut dysbiosis marker is also relevant: an imbalanced gut microbiome affects how cleared oestrogen is reabsorbed, and can contribute to an elevated oestrogenic load.
Low melatonin and elevated neuroinflammation help explain poor sleep and mood symptoms that might otherwise seem disconnected from a hormone test.
This is the DUTCH showing its depth: not just the hormone pattern, but the nutritional and gut context that's shaping it.
This suggests: addressing B12, B6 and gut health isn't just good general practice, it's specifically indicated by this profile, and likely to have a meaningful effect on the oestrogen clearance picture.
What makes this report genuinely useful?
It isn't any single finding. It's the connections between them.
Low progesterone relative to oestrogen.
Oestrogen clearing through less desirable pathways.
Methylation running low.
B12 and B6 flagged.
Gut dysbiosis present.
Neuroinflammation
These aren't 6 separate problems, they're five parts of the same picture, and they point toward the same set of priorities.
That's what good functional test interpretation looks like.

A scientist's perspective
The DUTCH Complete is the test I find most satisfying to interpret, because the data is genuinely multi-dimensional.
hormone levels,
metabolic pathways,
nutrient markers
gut indicators all in one report.
My research background means I'm comfortable with this kind of layered analysis, and I think it's where the test earns its keep: not in any single result, but in the patterns that emerge when you read everything together.
One important caveat: results always need interpreting alongside cycle stage, symptoms and history. Oestradiol at the high end of the luteal range means something very different in someone with heavy periods than in someone approaching menopause.
I'd also always note that if you're on HRT or hormonal contraception, this will significantly affect results and needs to be discussed before the test is ordered.
DUTCH results are always discussed as part of your programme and not sent through with a generic commentary.
If you're currently on HRT, hormonal contraception, or have been told you have a hormone-related condition, please mention this at the discovery call so we can discuss whether and how to use the test or whether an alternative test might be of more use
Further reading: more on how I think about functional testing and when it adds real value on the blog. Read the post →
Think there might be a hormonal pattern behind your symptoms?
The DUTCH is usually discussed partway through a programme, once we've built a picture of your symptoms and cycle history together. A free 30-minute discovery call is the best place to start.